

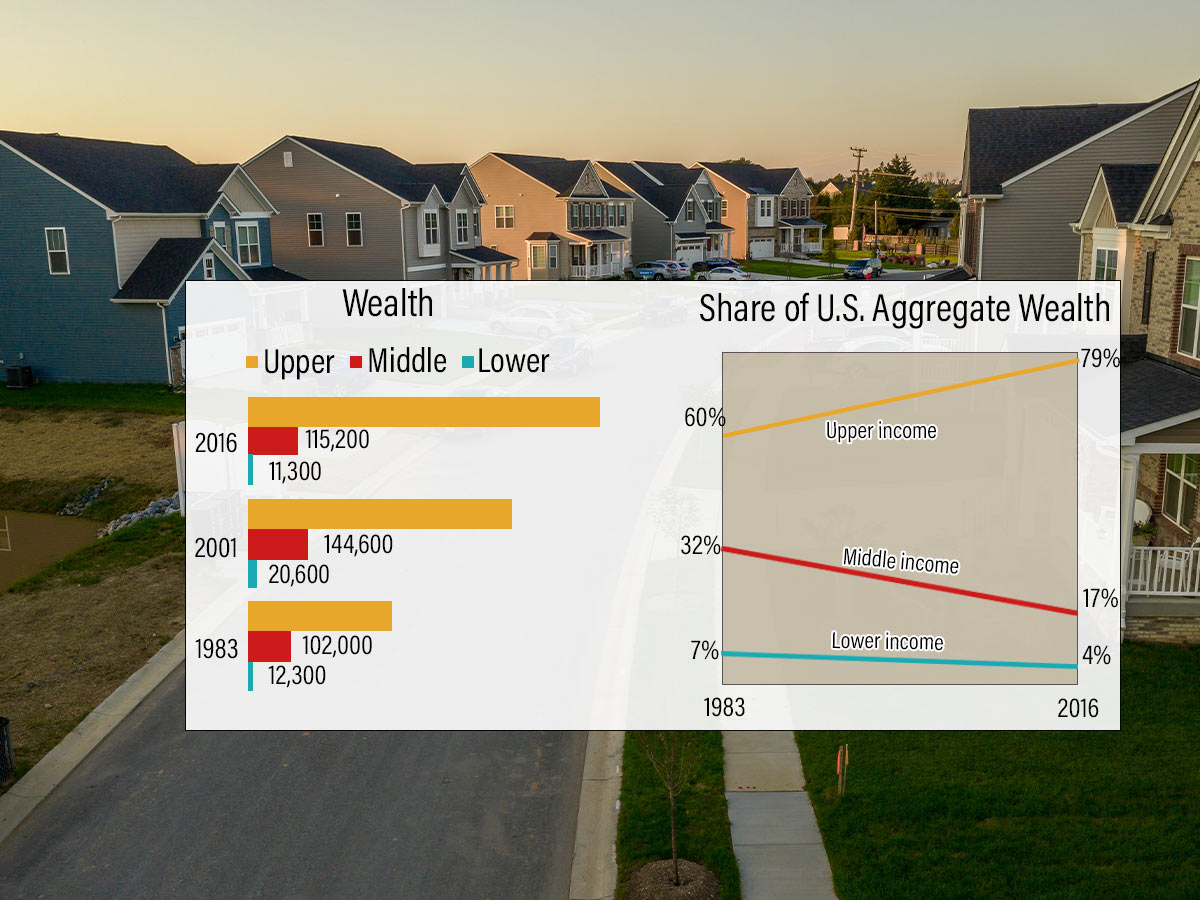
A strong middle class has historically been the backbone of economic stability, but it’s rapidly disappearing. Since the 1970s, the percentage of middle-class households in America has dropped from 61% to under 50%. This decline is driven by rising costs, wage stagnation, and the erosion of job security.
With fewer households able to save for emergencies or invest in homeownership, the ripple effect is felt throughout the economy. Consumer spending—the primary driver of economic growth—is slowing as more Americans struggle under the weight of higher living costs.
Takeaway: A shrinking middle class poses long-term risks not just to individual families but to the broader economy.
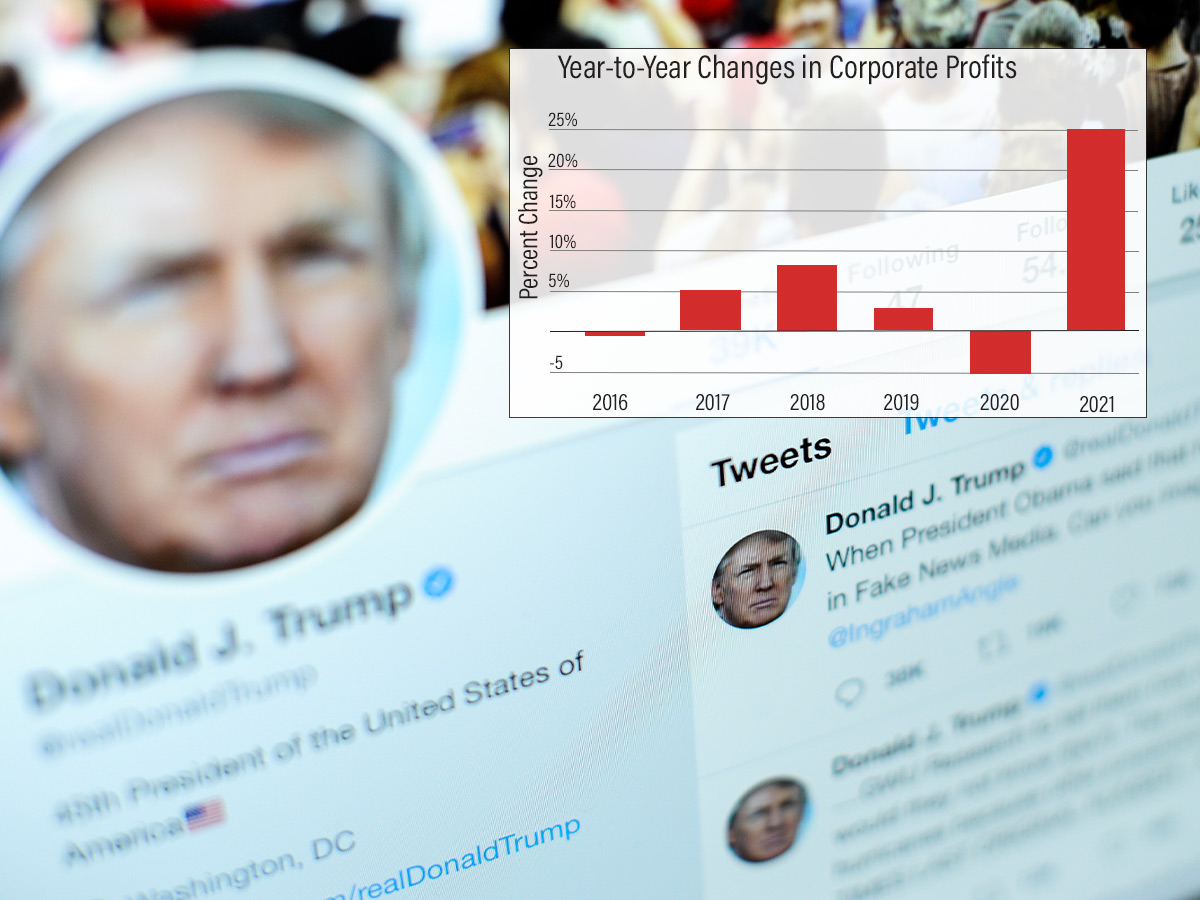
While many workers struggled to make ends meet during the COVID-19 pandemic, businesses reported record-breaking profits. According to a study, corporate profits in the U.S. skyrocketed in 2021 and 2022, hitting record highs of $2.8 trillion in annual profit margins—up nearly 25% from pre-pandemic levels. But instead of reinvesting in their workforces, several companies responded to economic uncertainty by announcing massive layoffs.
For example, in 2023, tech giants like Amazon, Meta, and Google collectively laid off over 200,000 employees despite enjoying immense financial gains. This practice has created a more precarious labor market where the burden of instability disproportionately impacts workers, even as CEOs cash in on record bonuses.
Takeaway: The disparity between corporate profits and worker treatment is growing, directly contributing to widening inequality.
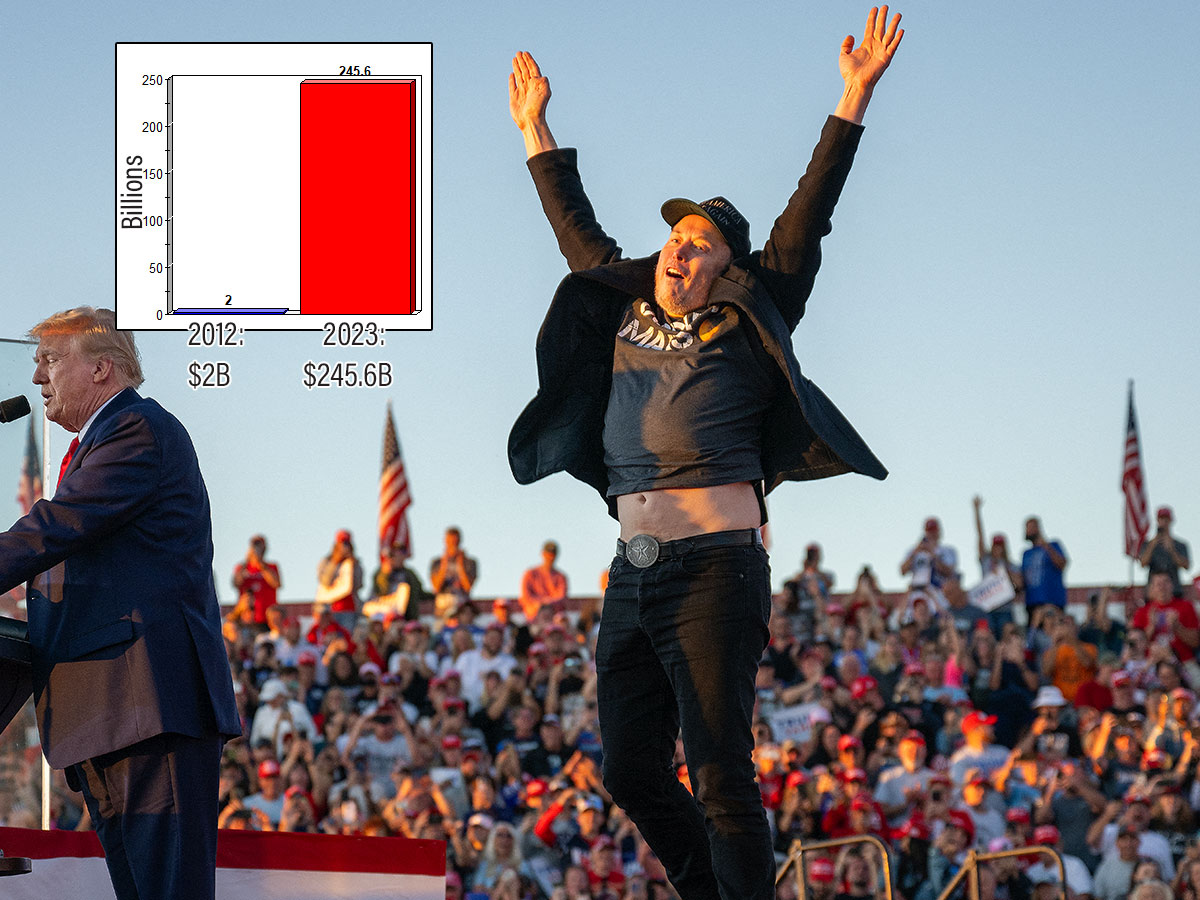
- Net Worth in 2012: $2B
- Net Worth in 2025: $245B (12150% increase)
Elon Musk has accumulated substantial wealth through government contracts and public funding—a whopping $8 Million a day—which have played a critical role in the success of his ventures. SpaceX, for instance, has secured billions of dollars in contracts from NASA and the U.S. Department of Defense, including a $2.9 billion deal to develop a lunar lander for NASA's Artemis program. These contracts have provided steady revenue streams and helped fund the company's ambitious projects, like reusable rockets and the Starlink satellite network.
Similarly, Tesla benefited from federal subsidies and tax credits for electric vehicles, as well as a $465 million low-interest loan from the U.S. Department of Energy in its early days, which helped the company scale production when it was still struggling financially. These government partnerships demonstrate how public resources have often been integral to Musk’s ability to innovate and grow his enterprises, raising questions about the balance between private profit and public investment in such ventures.

- Minimum Wage in 2012: $7.25
- Minimum Wage in 2025: $7.25
A full-time minimum-wage worker earns just $15,080 annually, while Musk’s net worth grows by approximately $8,000 per second. This juxtaposition demonstrates the stark difference in wealth accumulation for the ultra-rich compared to the stagnation for average Americans.
Takeaway: Billionaire wealth continues to soar unchecked, while stagnant wages leave workers struggling to cover basic expenses.
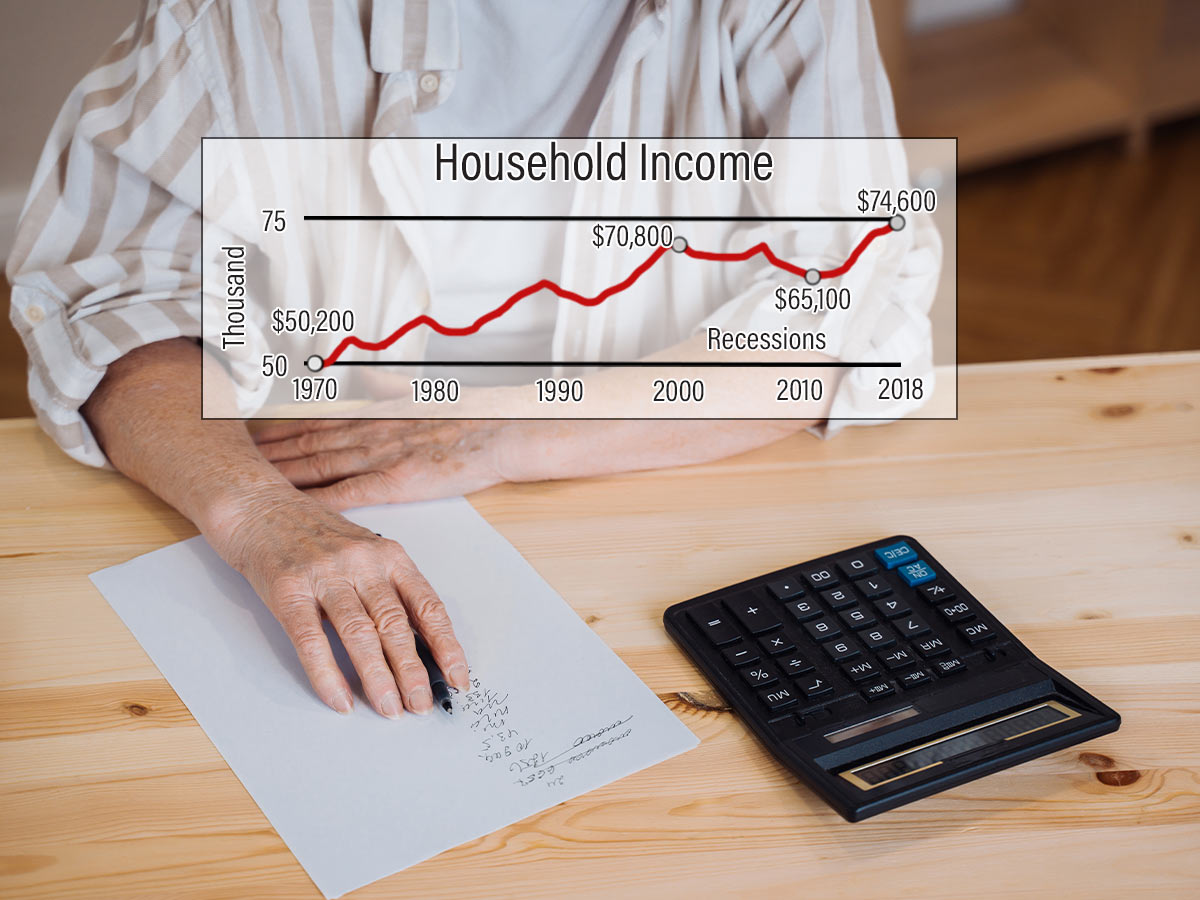
For decades, the middle class has faced stagnant household incomes when adjusted for inflation. Since the 1970s, the average American household has experienced only a modest income increase of 15%, while billionaire wealth has exploded by over 1,000% during the same period. This disparity has created a hollowing out of the middle class, as the cost of education, healthcare, and housing outpaces income growth.
A living-wage gap has also emerged, where middle-income earners can no longer sustain a comfortable standard of living without debt or significant sacrifices. Meanwhile, the ultra-wealthy grow richer through investments, tax loopholes, and wealth inheritance.
Takeaway: The stagnation of middle-class earnings stands in stark contrast to the accelerated wealth accumulation at the top.

The Tax Cuts and Jobs Act of 2017, spearheaded in the United States under then-President Donald Trump, was marketed as a middle-class tax relief initiative. However, the reality paints a starkly different picture. According to the Tax Policy Center, the top 1% of earners received an average tax cut of $50,000 per year, while the bottom 20% of earners saw only a measly $60 annual benefit.
This disparity highlights how tax legislation often tips the scale in favor of the elite, leaving everyday workers behind.

This one’s a real kick in the gut. While high-income earners might enjoy tax loopholes and deductions, low-income families tend to pay a higher percentage of their income toward necessities like payroll taxes, state taxes, and sales taxes. According to the Institute on Taxation and Economic Policy, the lowest 20% of earners pay around 11% of their income in taxes, while the wealthiest 1% pay just 7% when you take tax loopholes into account.
This regressive tax structure compounds inequality, making it even harder for low-income families to get ahead.
Congressional budget plans reveal alarming trends in how resources are distributed. Recent Republican proposals advocate for $880 billion in Medicaid cuts and reductions in other vital programs, including $230 billion slashed from food assistance programs like SNAP. These cuts disproportionately target low-income families and working-class Americans.
But who benefits from these policies? The same budget proposals extend $2.5 trillion in tax breaks to the top 10% of earners, with almost $1.24 trillion going to the top 1%. Essentially, low-income Americans are being required to foot the bill for tax breaks that primarily benefit the wealthiest among us.
Takeaway: Redistribution of wealth is actively happening, but it’s flowing upward from those who can’t afford it to those who need it least.

Despite decades of economic growth, the wealth of U.S. families has yet to fully recover from the devastation of the Great Depression. Wage stagnation has played a significant role, with income for most workers barely keeping pace with inflation over the last several decades. At the same time, the cost of living—including essentials like housing, education, and healthcare—has risen sharply, making it harder for families to build savings or invest in wealth-generating opportunities.
Further compounding the issue is the growing concentration of wealth among the top 1%, who have seen their fortunes swell while middle- and lower-income families struggle to make ends meet. This imbalance has created a widening wealth gap, leaving many Americans trapped in cycles of financial insecurity that echo the struggles of nearly a century ago.
